About
Resume
Blog
Contact
GitHub
Linkedin
Email
Categories
All
(5)
Dashboard
(1)
MEDS
(4)
Python
(1)
R
(4)
Remote sensing
(2)
Statistics
(1)
Visualization
(2)
Blog Posts
Visualizing My Personal Spending Data Using R-Shiny
R
Visualization
Dashboard
Using R-Shiny to re-create the Mint (by Intuit) interactive dashboard
Jun 20, 2024
Briana Barajas
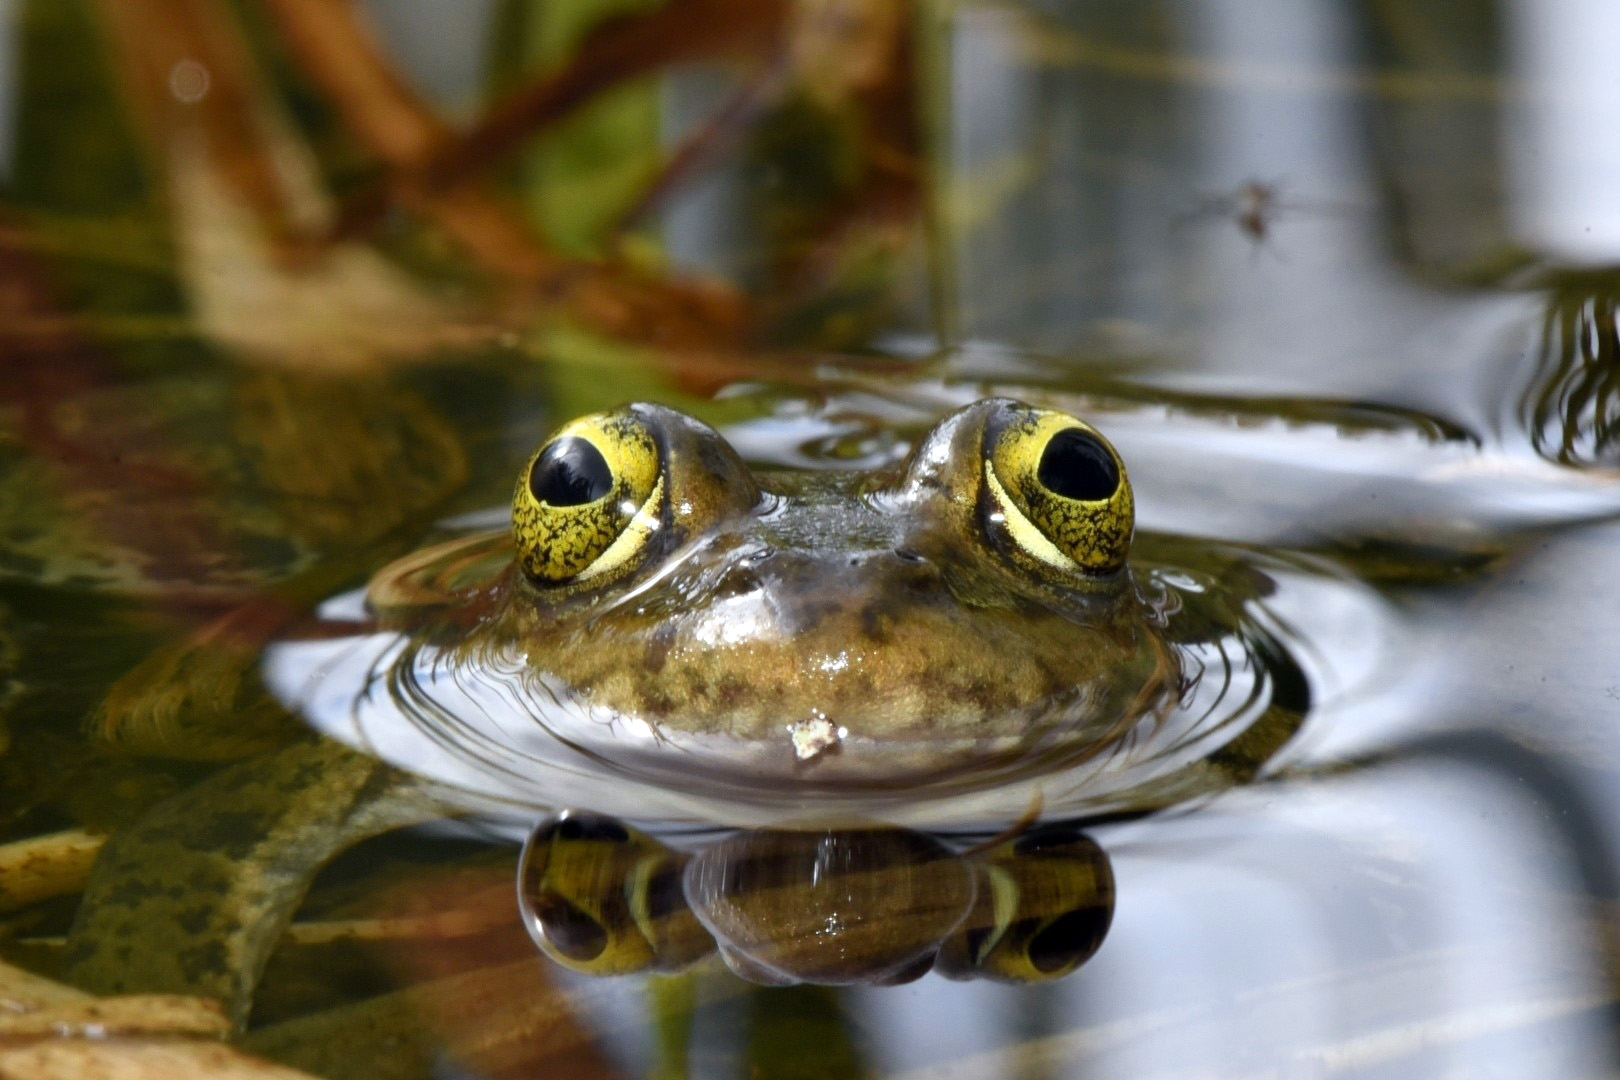
Creating an infographic using Oregon spotted frog capture data
MEDS
R
Visualization
Creating custom data visualizations in R using mark-recapture data from USGS
Mar 12, 2024
Briana Barajas
NDVI Assessment Around Santa Clara River
MEDS
R
Remote sensing
Calculating NDVI using Landsat remote sensing data around the Santa Clara River area
Dec 15, 2023
Briana Barajas
Air Quality Assesment of California Thomas Fire
Python
MEDS
Remote sensing
An analysis of the Thomas Fire, including a raster image of the fire’s perimeter and plots depicting the air quality (AQI) in affected counties.
Dec 13, 2023
Briana Barajas
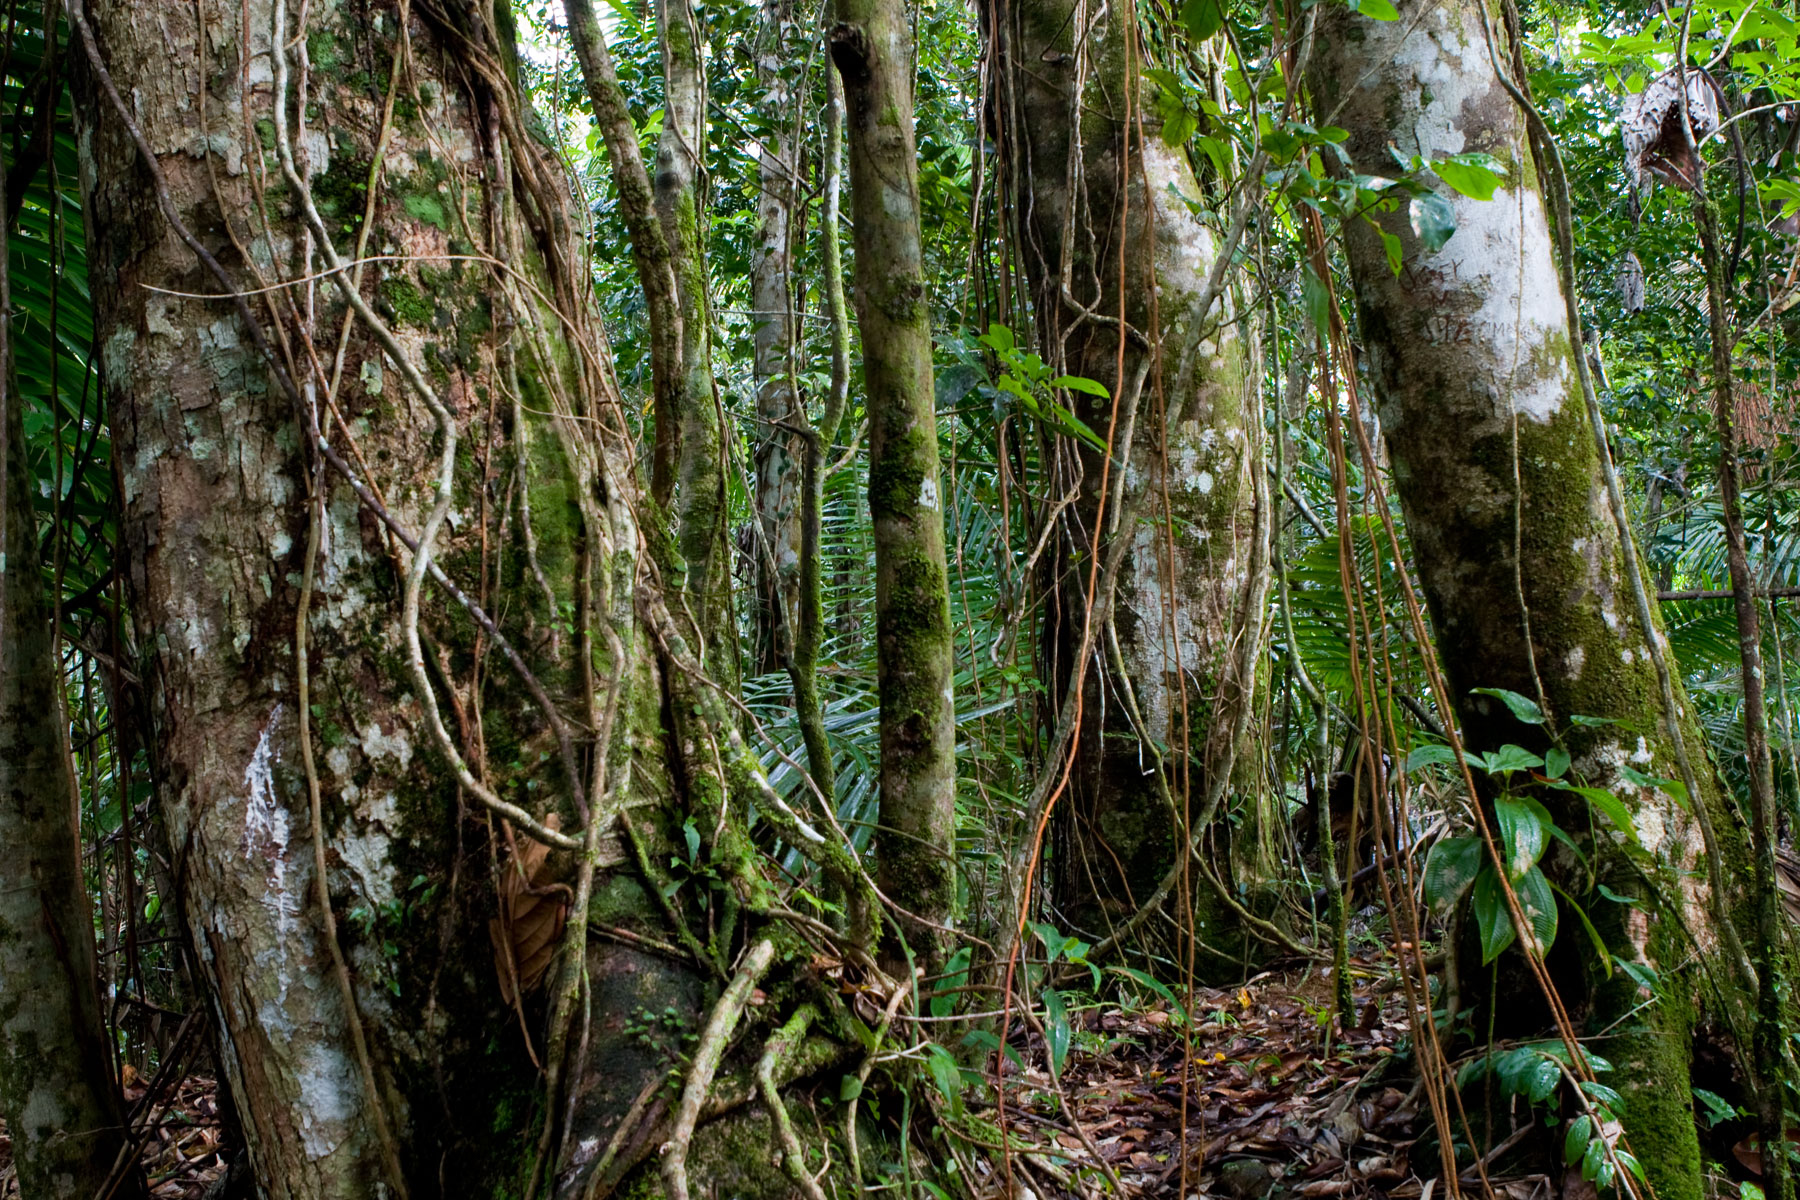
Drought Tolerance in Tropical Tree Species
MEDS
R
Statistics
Comparison of linear models, summarizing tropical tree growth during a severe drought
Dec 10, 2023
Briana Barajas
No matching items